API for pysmithchart package
pysmithchart.axes Module
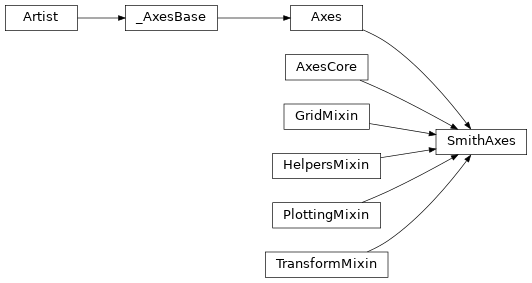
Main SmithAxes class assembled from modular components.
This module provides the main SmithAxes class which extends matplotlib’s Axes to create Smith Charts. The implementation is split across multiple mixin classes for better organization and maintainability.
Classes
|
A subclass of |
Class Inheritance Diagram
pysmithchart.constants Module
Constants and Default Parameters for Smith Chart Plotting.
This module provides parameter type definitions and a comprehensive set of constants used for configuring Smith Chart plots with matplotlib. These settings include defaults for plot styling, gridlines, axes, and symbol representations, as well as numerical tolerances.
Parameter Types
R_DOMAIN: Indicates scattering parameters (reflection coefficient Γ).Z_DOMAIN: Indicates impedance parameters (always normalized by Z₀).NORM_Z_DOMAIN: Indicates absolute/unnormalized values (plotted as-is).Y_DOMAIN: Indicates admittance parameters.
Numerical Constants
SC_EPSILON: Tolerance for numerical comparisons (1e-7).SC_INFINITY: Value representing “infinity” (1e9).SC_NEAR_INFINITY: 90% ofSC_INFINITY.SC_TWICE_INFINITY: TwiceSC_INFINITY.
Matplotlib Default Parameters (RC_DEFAULT_PARAMS)
The default parameters used to configure matplotlib are defined in the dictionary below:
{
    "axes.axisbelow": True,
    "font.size": 12,
    "legend.fontsize": 12,
    "legend.fancybox": False,
    "legend.markerscale": 1,
    "legend.numpoints": 3,
    "legend.shadow": False,
    "lines.linestyle": "-",
    "lines.linewidth": 2,
    "lines.markeredgewidth": 1,
    "lines.markersize": 5,
    "xtick.labelsize": 10,
    "xtick.major.pad": 0,
    "ytick.labelsize": 10,
    "ytick.major.pad": 4,
}
Smith Chart Default Parameters (SC_DEFAULT_PARAMS)
Axes Settings:
axes.xlabel.rotation(int): Rotation angle for x-axis labels (default: 90).axes.xlabel.fancybox(dict): Parameters for the label background box.axes.Z0(int): Reference impedance for normalization (default: 50).axes.radius(float): Radius of the plotting area (default: 0.43).axes.normalize(bool): If True, normalize the chart to the reference impedance.axes.normalize.label(bool): If True, display a normalization label.axes.normalize.label.position(complex): Position of the normalization label.axes.ylabel.correction(tuple): Correction for y-axis label positioning.
Grid Settings:
grid.zorder(int): Z-order for grid lines (default: 1).grid.locator.precision(int): Number of significant decimals per decade (default: 2).grid.fancy(bool): Use fancy grid drawing for smith charts.grid.major.threshold(tuple): Visual threshold for spacinggrid.minor.threshold(int): Visual threshold for minorspacing
Major Grid (Impedance):
grid.Z.major.enable(bool): Enable the major grid.grid.Z.major.linestyle(str): Line style.grid.Z.major.linewidth(int): Line width.grid.Z.major.color(str): Color of grid lines (also set for color.x and color.y).grid.Z.major.real.divisions(int): Maximum divisions on the real axis.grid.Z.major.imag.divisions(int): Maximum divisions on the imaginary axis.
Minor Grid (Impedance):
grid.Z.minor.enable(bool): Enable the minor grid.grid.Z.minor.capstyle(str): Cap style for dash segments.grid.Z.minor.dashes(list): Dash style pattern.grid.Z.minor.linewidth(float): Line width.grid.Z.minor.color(str): Color for grid lines (also set for color.x and color.y).grid.Z.minor.real.divisions(int or None): Number of divisions between major ticks on the real axis. If None, divisions are computed automatically per interval for uniform spacing.grid.Z.minor.imag.divisions(int or None): Number of divisions between major ticks on the imaginary axis. If None, divisions are computed automatically per interval for uniform spacing.
Admittance Grid Settings:
Major Grid (Admittance):
grid.Y.major.enable(bool): Enable the major admittance grid.grid.Y.major.linestyle(str): Line style for admittance grid.grid.Y.major.linewidth(int): Line width for admittance grid.grid.Y.major.color(str): Color of admittance grid lines.grid.Y.major.color.x(str): Color for conductance circles.grid.Y.major.color.y(str): Color for susceptance circles.grid.Y.major.alpha(float): Alpha transparency for admittance grid.grid.Y.major.real.divisions(int): Maximum divisions on conductance axis.grid.Y.major.imag.divisions(int): Maximum divisions on susceptance axis.
Minor Grid (Admittance):
grid.Y.minor.enable(bool): Enable the minor admittance grid.grid.Y.minor.linestyle(str): Line style for minor admittance grid.grid.Y.minor.capstyle(str): Cap style for dash segments.grid.Y.minor.dashes(list): Dash style pattern.grid.Y.minor.linewidth(float): Line width for minor admittance grid.grid.Y.minor.color(str): Color for minor admittance grid lines.grid.Y.minor.color.x(str): Color for minor conductance circles.grid.Y.minor.color.y(str): Color for minor susceptance circles.grid.Y.minor.alpha(float): Alpha transparency for minor admittance grid.grid.Y.minor.real.divisions(int or None): Number of divisions for conductance.grid.Y.minor.imag.divisions(int or None): Number of divisions for susceptance.
Plot Settings:
plot.zorder(int): Z-order for plot lines.plot.marker.default(str): Default marker for line points.plot.default.domain: Default domain for plots (REFLECTION, IMPEDANCE, ADMITTANCE, or ABSOLUTE).plot.default.interpolation(int): Number of interpolated steps between points.
Additional Parameter:
init.updaterc(bool): Flag indicating whether to update matplotlib’s rc parameters.
pysmithchart.core Module
Core SmithAxes class with initialization and configuration.
Classes
|
Core functionality for SmithAxes including initialization and configuration. |
Class Inheritance Diagram

pysmithchart.formatters Module
This module contains the implementation for formatters.
Classes
|
Formatter for the real axis of a Smith chart. |
|
Formatter for the imaginary axis of a Smith chart. |
Class Inheritance Diagram

pysmithchart.grid Module
Grid drawing functionality using constant value plotting functions.
Classes
Mixin class providing grid drawing methods for SmithAxes. |
Class Inheritance Diagram

pysmithchart.helpers Module
Helper and utility methods for SmithAxes.
Classes
Mixin class providing helper methods for SmithAxes. |
Class Inheritance Diagram

pysmithchart.locators Module
This module contains the implementation for locators.
Classes
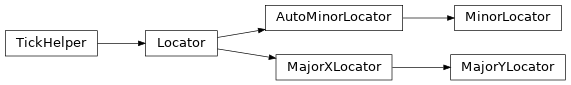
|
A locator for the real (resistance/X) axis on the Smith chart. |
|
Locator for the imaginary (reactance/Y) axis of a Smith chart. |
|
Minor tick locator for Smith chart axes. |
Class Inheritance Diagram
pysmithchart.moebius_transform Module
This module contains the implementation for moebius transform.
Classes
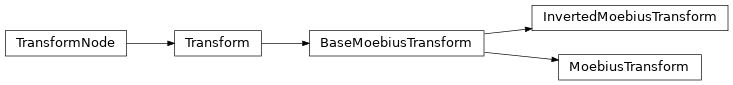
|
Transform points and paths into Smith chart data space. |
|
Perform the inverse transformation for points and paths in Smith chart data space. |
Class Inheritance Diagram
pysmithchart.plotting Module
Plotting functionality for SmithAxes.
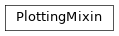
Classes
Mixin class providing plotting methods for SmithAxes. |
Class Inheritance Diagram
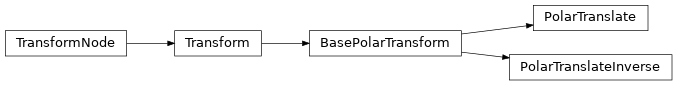
pysmithchart.polar_transform Module
This module contains the implementation for polar transform.
Classes
|
Transformation for translating points radially outward from the center of the Smith chart. |
|
Inverse transformation for PolarTranslate. |
Class Inheritance Diagram
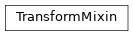
pysmithchart.transforms Module
Transform-related functionality for SmithAxes.
Classes
Mixin class providing transform-related methods for SmithAxes. |
Class Inheritance Diagram
pysmithchart.utils Module
Utility functions for Smith chart computations.
This module provides mathematical utilities, transformations, and helper functions for working with Smith charts and RF impedance calculations.
- Public Functions:
- Domain Validation:
validate_domain(domain, allow_none): Validate domain parameter get_domain_name(domain): Get human-readable domain name
- Complex Number Utilities:
xy_to_z(xy): Convert x,y components to complex z_to_xy(z): Split complex into x,y components split_complex(z): Alias for z_to_xy cs(z, N): Format complex number as string
- Möbius Transformations:
moebius_transform(z, norm): Forward Möbius transform (Z → Gamma) moebius_inverse_transform(s, norm): Inverse Möbius transform (Gamma → Z)
- RF Calculations:
calc_gamma(Z_0, Z_L): Calculate reflection coefficient calc_vswr(Z_0, Z_L): Calculate VSWR from impedances calc_load(Z_0, gamma): Calculate load impedance from Gamma reactance_to_component(X, freq): describe reactance as C or L
- Angle/Wavelength Conversions:
ang_to_c(ang, radius): Angle to complex on circle lambda_to_rad(lmb): Wavelength fraction to radians rad_to_lambda(rad): Radians to wavelength fraction
Functions
|
Validate that a domain parameter is valid. |
|
Get a human-readable name for a domain constant. |
|
Converts input arguments to a complex scalar or an array of complex numbers. |
|
Converts input data to separate x (real) and y (imaginary) arrays. |
Splits a complex number into its real and imaginary components. |
|
|
Convert complex number to string for printing. |
|
Apply Möbius transformation to impedance values. |
|
Apply inverse Möbius transformation to reflection coefficients. |
|
Computes the reflection coefficient Gamma for a load impedance. |
|
Computes VSWR for a load impedance referenced to Z0. |
|
Computes the load impedance ZL from reflection coefficient Gamma. |
|
Converts an angle to a complex number on a circle with the given radius. |
|
Converts a wavelength fraction to radians. |
|
Converts an angle in radians to a wavelength fraction. |
|
Choose a minor-grid divider that yields visually acceptable spacing. |
|
Convert reactance to component value (L or C). |